Gantt Chart monthly basis
Save, fill-In The Blanks, Print, Done!

Download Gantt Chart monthly basis
Microsoft Word (.docx)Or select the format you want and we convert it for you for free:
Other languages available:
- This Document Has Been Certified by a Professional
- 100% customizable
- This is a digital download (37.52 kB)
- Language: English
- We recommend downloading this file onto your computer.

How to create a Gantt chart in Excel? What is a Gantt chart and what is a Gantt chart used for? Our Gantt Chart template is designed for easy customization and is regularly updated. You can download the template in Excel or PDF format to get started. The template also includes instructions to help you create and manage your Gantt Chart quickly and easily.
A Gantt chart can be a very efficient and effective project management tool, and they are a very popular method to put your needs and project goals clear on paper. It is considered one of the best project management tools. A Gantt chart is a kind of bar diagram, invented by Henry Gantt in the 1910s, that outlines a company or project schedule. Gantt charts outline the beginning and completion dates of the elementary components of a project. The total of all elementary project components can be called "the work breakdown structure of the project".
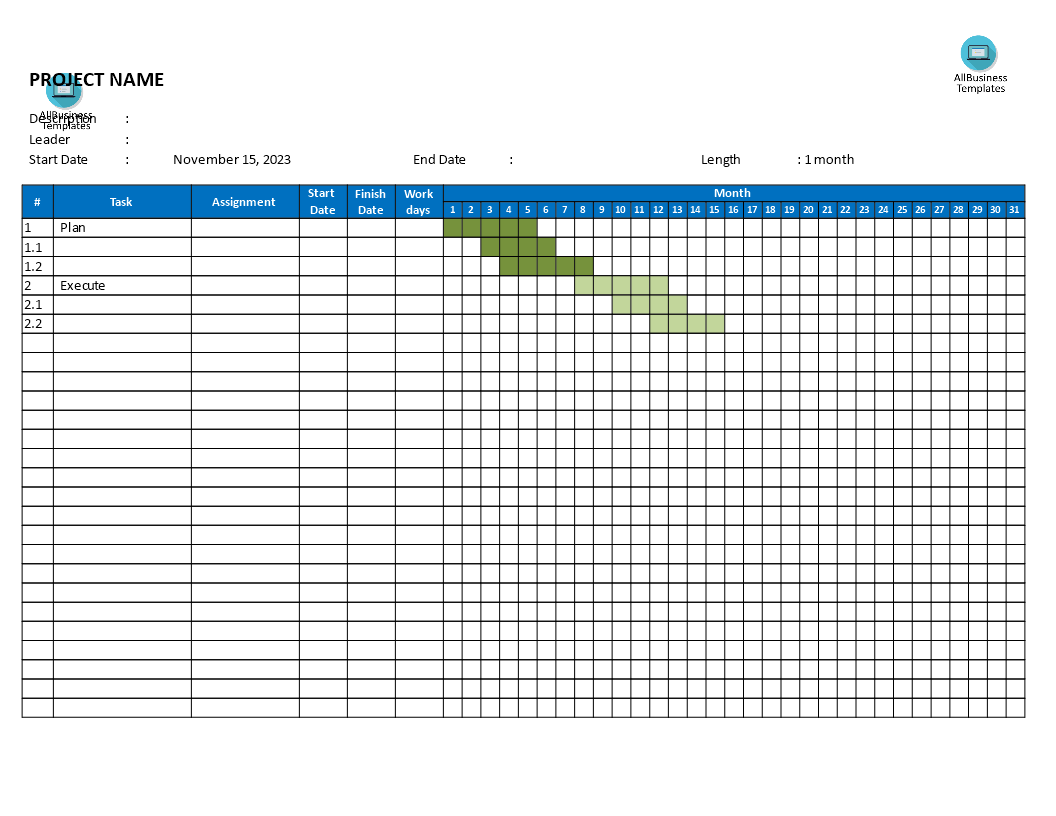
Here are the key features of a Gantt Chart on a monthly basis:
- Monthly Timeline: The chart shows the progression of time on a monthly scale. Each month is represented along the timeline, and the duration of the project extends across these months.
- Task Bars: Tasks are represented by horizontal bars positioned along the monthly timeline. The length of each bar corresponds to the duration of the task, and the placement on the timeline indicates when the task is scheduled to start and finish.
- Dependencies: If there are dependencies between tasks (i.e., one task must be completed before another can start), these dependencies are visually indicated on the chart. This helps in understanding the order and relationships between tasks over the monthly timeframe.
- Milestones: Significant project milestones, such as key deliverables or project reviews, may be marked on the timeline. Milestones help highlight important points in the project's progress.
- Resource Allocation: The Gantt Chart on a monthly basis can also be used to allocate resources efficiently. It shows when specific resources are needed for each task throughout the monthly timeline.
- Progress Tracking: As the project progresses, the Gantt Chart is updated to reflect the actual start and finish dates of tasks. This allows for real-time tracking of project progress on a monthly scale.
Using a Gantt Chart on a monthly basis is particularly helpful for projects with longer timelines or projects where a monthly overview is sufficient for planning and monitoring. It provides a clear visual representation of the project schedule, making it easier for project managers and team members to understand the timing and sequencing of tasks over the course of each month.
Our Project Management Planning template enables you to create free Gantt chart to structure your thoughts on every detail in a professional way! This Gantt Chart template will help you to reach the next level of success in your work, education, and business.
DISCLAIMER
Nothing on this site shall be considered legal advice and no attorney-client relationship is established.
Leave a Reply. If you have any questions or remarks, feel free to post them below.
Top 5 Gantt Chart planning templates
Are you looking for effective strategic, tactical and operational Gantt chart planning templates to improve your personal, teams' or companies efficiency and effectiveness? These ready-to-use Gantt chart planning templates will surely help you out!
Read moreOther templates


Latest templates
Latest topics
- Appointment Letter template
Appointment letters serve as the foundational documentation for formalizing professional agreements, transitions, and logistics. - Competitive Product Analysis
Gain a Market Edge by Utilizing Free Competitive Product Analysis Templates. - IT Security Standards Kit
What are IT Security Standards? Check out our collection of this newly updated IT Security Kit Standard templates, including policies, controls, processes, checklists, procedures and other documents. - AI Cheat Sheet
How to Prompt Perfectly? Check out this 11 Essential AI Prompting Cheat Sheet, the Ultimate AI Prompt Engineering Guide! - Travel Smart with Home Exchange
What if you could experience luxury stays around the world! Travel Smart with Home Exchange & House Swap
cheese